Saturday, March 23, 2013

Pitching and Winning

Best ERA- but didn't mean a championship
It is safe to say that both team's and and pitcher's need to do the same thing to win, and that is to prevent the other team from crossing home plate. That is why ERA has the biggest correlation between winning and a statistic for both individuals and a group. After we determined that runs were the most important thing in winning games, today we decide that runs against is just as important. Along with ERA the other stats measured today will be: saves, batting average against, WHIP, batting average on balls in play, Fielding Independent Pitching, and the ERAs of both the team's relievers and starters. All stats except for Saves naturally have a negative correlation due to their nature of lower is better, so the absolute value of those stats were taken while Saves had their normal correlation.
1. ERA correlation=.8125
Gonzalez
The Rays had the league's lowest ERA at 3.19 and had the 9th most wins with 90. The Washington Nationals, led by Gio Gonzalez and Steven Strasburg, had the second best ERA and led the majors with 98 wins. The World Series Champion Giants had a 3.68 ERA which is good enough for 7th on the list. Despite a 3.76 ERA, the Mariners were only able to win 75 games.
2. WHIP correlation=.803
Again similar to ERA, David Price and the Rays led the majors with a WHIP of 1.17 and the Nationals took second at 1.22. Felix Hernandez again got the Mariners in the top 6 despite their lackluster record. The Brewers were the only team with a WHIP above 1.3 to win more than 80 games.
3. Saves correlation= .77889
Not really surprise here as you can only get a save if you win the game. The Reds had the most saves in the majors (56) and Aroldis Chapman had 38 of them and they won 97 games. The Pirates had 45 saves (Joel Hanrahan having 36 of them) despite only winning 79 games. The Orioles finished second in saves as Jim Johnson got 51 of their 55 saves. The Angels won 89 games despite recording only 38 saves as they were a little bit of an outlier.
4. Starter ERA correlation= .71457
What a surprise here, again the Rays and the Dodgers take the top two spots. Clayton Kershaw led the majors in ERA and it helped the Dodgers get the third spot with a starter ERA of 3.41 and 86 wins. The Mets R.A. Dickey boosted them into the 11 spot but they only had 74 wins on the year. The Orioles, who are looking to have a pretty bad this year, made it far with bad starters sporting an ERA of 4.42 but won 93 games.
5. Batting Average Against Correlation=.704
So again the Rays, Nationals, and Dodgers take the top three spots with opponent batting averages below .235. The Rockies, who have been near the bottom of the list in almost every category are in dead last here with teams hitting .284 of their pitchers, which is .014 points higher than the second to last Twins. Not surprisingly, the Rockies only won 64 games.
6. Fielding Independent Pitching correlation=.684
Just wanted to show
 the Cuba Red
This statistic is used to determine the ERA of a pitcher if it wasn't for shoddy defense, or in the other direction great defense. The Rays and Nationals again take the top two spots but three and four look a little different this time. Adam Wainwright's FIP of 3.10 led the Cardinals to the 3 spot and Justin Verlander's 2.94 FIP put the Tigers in fourth. 
7. Reliever ERA correlation=.6525
Aroldis Chapman had the third  best ERA among reliever's last year (1.51) and it helps put the Reds on top of the list. The Braves took second with Craig Kimbrel and Eric O'Flaherty both finishing in the top 5. Fernando Rodney had a major league best .60 ERA for the Rays and the team had a 2.88 reliever ERA which was third in the league. The World Champion Giants had the 15th best bullpen but that was likely do to Brain Wilson missing most of the season. 
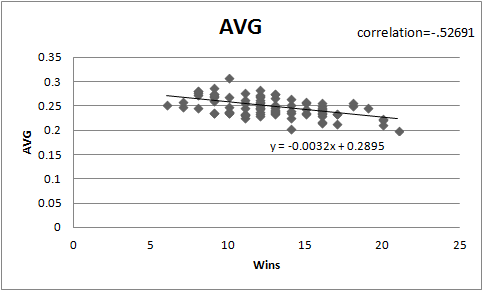
8. Batting Average on Balls in Play correlation=.48
Not a terrible correlation but not a good one. The Tigers were 27th in the league in BABIP and still had 81 wins and the Yanks won 95 despite finishing 19th. The Rays and Angels were first in the league with a .277 BABIP and the Athletics who won 94 games finished third witha .279 BABIP.


Friday, March 22, 2013

What makes Teams Win- Offense?

Most wins; third most runs

Yesterday we discussed what statistic has the biggest impact on a pitcher's ability to win and determined that the better a pitcher's ERA, the more wins that pitcher was likely to have. Today there is going to be a similar topic, what makes a team win. Today will focus on the position players while tomorrow will be pitching. The statistics that will be compared to wins today are Runs, Strikeouts, Stolen Bases, Batting Average, On Base Percentage, and two metrics from fangraphs.com that measure fielding and baserunning. The stats will be listed from greatest correlation to worst correlation.
1. Runs
Not much to be surprised by here, games are decided by runs so it's likely that the more you score, the more you win. What is a little surprising is that the Washington Nationals had the most wins in MLB last year, 98, but came in 10th in runs with 731. The Rangers, who led the majors with 808 runs won 93 games. The Terrible Houston Astros only won 55 games, worst in the league, and only had 583 runs, worst in the league.

2. On Base Percentage + Slugging
Hailed as the super stat among players OPS has a .49 correlation for team's wins. The Yankees were the league's most patient and powerful hitters with an OPS of .790 and won 95 games. The Rockies pitching was horrible and that prevented the team from having a good season despite their offenses .766 OPS which ranked them third in the league. The Nationals placed 8th in the league with an OPS of .750.

3. Fielding Metric
There is the saying that defense wins championships and it shows to be somewhat true as the World Series Giants had the 10th highest fielding measuring in at 13. The Braves, who lost in the Wild-Card showdown had a fielding metric of 58.6 and won 94 games on the season. The Red Sox, who only won 69 games, were a surprisingly strong fielding team (34.6).

4. On Base Percentage
Hailed as the wonder stat by the Moneyball generation (then replaced by OPS), OBP does a fine job predicting winners but falls just behind Fielding. The Cardinals and the Yankees were the top two teams and reached 88 and 95 wins respectively. The Athletics, who had 94 wins had an OBP of only .310, bad enough for 24th in the league. The Marineers, who had a league worst .296 OBP, had 75 wins.

5. Batting Average
The first recorded statistic for batters means a lot less than expected with a correlation of .268. The Cardinals had the highest batting average in the league and the Yanks placed second. The Tigers, who were the runner ups in the World Series, had the third highest batting average at .268. The Nationals were not that strong of a hitting team only coming in at #12.

6. Baserunning
Actually has almost no correlation at all coming in at .10. Strikeouts and Stolen Bases actually have a higher correlation rating but there are the opposite of what was expected. Strikeouts actually had a positive correlation while stolen bases had a negative. The Angels had the best Baserunning rating and finished with 89 wins, but on the other end of things the Nationals came in last and led the majors in wins.

7. Strike Outs
This actually shows that the more a team strikes out, the higher their chances of winning are, but ever so slightly. The Athletics led the majors with 1387 strikeouts but still had 94 wins. In second was the Astros who only had 55 wins. The team with the least amount of strikeouts, the Kansas City Royals who had 72 wins.

8. Stolen Bases
Alright, this actually has a stronger correlation than strike outs but it is the opposite correlation of what we want. Teams are better off stealing less because the more you steal, the likelier you are to get thrown out and lose a runner. The Brewers led the majors in with steals and had 83 wins while the Orioles were last with 58 steals but won 93 games.


Thursday, March 21, 2013

What Makes A Pitcher Win?

Gio Gonzalez led the majors with 21 wins lat year
One of the first recorded statistics in sports was the pitcher's win, but where do those wins come from. Today we will look at what statistics correlate the most with wins. There has been a bit of a movement recently to stop considering the win an important statistic due to factors like run support and defense. But is it possible that wins come from stats like ERA and strikeouts already, and that there is no need to discount wins, but rather view them as the culmination of other statistics. The statistics that will be compared to wins today are ERA, K/9, K/BB, AVG, WHIP, BABIP, tERA, and Fastball Velocity. Stats appear in order of Correlation. 88 pitchers who qualified for the ERA tile were used in this study.
1. (ERA Earned Runs/ IP)x9
I cannot say that I am overly surprised with this one considering that it, along with wins and strikeouts, is one of the numbers in the pitching triple crown. Gio Gonzalez led the majors with 21 wins last year and had the 9th lowest ERA at 2.89. Clayton Kershaw, who led the majors with a 2.53 ERA had 14 wins. The biggest wrench in the data was Cliff Lee, who was last among the 88 pitchers with only 6 wins, but his 3.16 ERA was 15th overall. It earned the number one spot with a correlation of .64351.

2. WHIP (Walks + Hits)/ Innings Pitch
Clayton Kershaw again led the majors in this category with a 1.02 WHIP. Gonzalez placed 12th at 1.13. Jake Peavy and Cliff Lee threw curveballs in this category both placing in the top 10 but Peavy only had 11 wins and as said earlier Lee had 6. The correlation was -.55608.
3. True ERA ERA adjusted for Defense and other variables
Should have had more than 14 wins
Coming in third with a correlation of -.53644, tERA was led again by Clayton Kershaw who had a terrible offense in LA. Gio Gonzalez placed fifth with a tERA of 3.34 and Cliff Lee showed up again screwing up the data with the third lowest tERA. Jeremy Guthrie, who only had 8 wins, had the highest tERA of the 88 pitchers with 6.33.
4. Batting Average Against
Gonzalez led the majors with a .202 BA against so that might make you think that this should have the strongest correlation. Another reason that this might be seen to have a high correlation is that Cliff Lee and his 6 wins doesn't show up until 55 on this list. The problem with this is that most of the data is spread throughout with Nationals' Edwin Jackson and Ross Detweiler taking 22 and 23 with 10 wins and BA of .237.
5. Strikeouts per 9 innings
There was a huge dropoff here going from a -.52691 correlation to a .295676 correlation for K/9. Max Scherzer led with 11.08 and had 16 wins. Yu Darvish was second with 10.4 and also had 16 wins. Gonzalez was third in K/9. Clayton Richard had 14 wins but only had 4.4 K/9.

6. Batting Average Against on Balls in Play
This stat is often used to project how a player will do in following seasons or how a player will do whe traded to a new team  but it does not correlate that well with wins. In fact, the correlation is only -.27. Jared Weaver led the majors with a .241 BABIP and as second in the league with 20 wins. However, Ervin Santana, who was second in BABIP, only had 9 wins.
7. Strikeouts/ Walks
This stat really seems like it should be a strong indicator of who wins or loses but the the pitchers with the highest two K/BB, Cliff Lee and Joe Blanton only had 6 and 10 wins respectively. This again is just because Cliff Lee had a terrible offense in Philadelphia, at least when he pitched. Gonzales doesn't appear til 46 on the list, having a K/BB of 2.72.

8. Fastball Velocity
Proves You Don't need to throw hard to win
This only has a correlation of .09 and that is really to be expected. We should all know that wins has very little to do with how hard you throw the ball, but how you make it dance and where you put it. It doesn't hurt necessarily as David Price had the hardest fastball in the majors with 95.5 MPH and had 20 wins. Jeff Samardzija had the second fastest fastball but only 9 wins, mostly due to the Cubs sucking ass. Gio's fastball averaged 93 MPH. Knuckleballer RA Dickey had 20 wins with a fastball of only 83.4 MPH.


Tuesday, March 19, 2013

Winning and Turnovers

Turnover Rules do not apply to them

We have all heard "the teams that win at the end of the season are the teams with the least amount of turnovers" and I think it is fair to say that it is true. But wouldn't it be interesting to know which sport lays the greatest importance on controlling the ball. To figure this out we used numbers from basketball and football, both at the professional and collegiate level.
NBA
The team with the best turnover margin in the NBA is the Atlanta Hawks, who are able to turn the ball over 3.1 times less than their opponents in each game. When it comes to winning however they are only 10th in the league with a .561 winning percentage. The second winningest team in the NBA, the San Antonio Spurs, actually have a negative turnover margin while the Miami Heat, currently on a 23 game winning streak, are +.8. The Bobcats, who are worst in the league when it comes to winning, are actually in the positives when it comes to turnovers. The slope for the trend line is 2.9 which places the NBA second when it comes to turnovers equaling victory.

NFL
Atlanta and Denver tied for best winning percentage in the NFL despite the Broncos having a negative (-.2). Another team that broke the stereotype was the Indianapolis Colts who had the seventh best winning percentage (.688) even though they lost the ball an average (-.7) more than they got it. Philadelphia's bad season, 4-12, can easily be attributed to their league worst -1.5 turnover margin. No team had a winning percentage below .500 and a turnover margin greater than .5. The NFL's slope was 2.45 which is just behind the NBA and places it at third among the leagues covered.

College Basketball
 Obviously the most amount of data is to be found in College Basketball as their is over 340 teams. Gonzaaga had the highest winning percentage at .938 also had a great turnover margin (2.4). The only teams with winning percentages over .800 that had negative turnover margins were Kansas (-.8), Bucknell (-.6, terrible conference), St. Marys (-.4), and Weber State (-1.6). Louisiana Tech had a great turnover margin at 5.2 and finished with a WP of .806. Grambling State, who failed to win a game all year had a -7.8 turnover margin, to no ones surprise. NCAA basketball has a slope of 5.09 which puts it firmly in first place.

College Football
Ohio State was perfect last year but weren't able to play in the BCS due to sanctions. They weren't amazing when it comes to turn over margin either only at .2. Florida State was sixth when it came to winning percentage but had a negative -.6 TO margin. Chamion Alabama TO margin was 1.2 while the team they defeated, Notre Dame, was .8. Southern Methodist was the only team with a WP below .200 to have a positive TO margin. College football had a slope of just one making turnovers mean the least. This is probably due to teams playing in shitty conferences and such.

Monday, March 18, 2013

Upset Bracket Power Rankings


With the Brackets for the NCAA tournament coming out yesterday Hawks Report wanted to come out with a way to not necessarily find the best bracket possible; but to create the best upset bracket. So I went to work working on a formula and I think I have come up with the solution. We will start in the East side of the bracket.

What is most surprising about the East is the fact that #1 Indiana only comes in at #9 on our rankings. Indiana's biggest problem was their tendency to turn the ball over and not force many out of their opponents. Although they played strong all year in games against other tough teams they really struggled. Syracuse rings in at #1 with a strong ability to grab the boards and above average numbers in both offensive and defensive efficiency.


Ranking Team Seed Rating
1 Syracuse 4 0.250779
2 Colorado 10 0.238963
3 Temple 9 0.209451
4 Miami (FL) 2 0.207098
5 UNLV 5 0.194206
6 California 12 0.194062
7 Marquette 3 0.185362
8 NC State 8 0.178979
9 Indiana 1 0.17494
10 Butler 6 0.170936
11 Bucknell 11 0.160499
12 Pacific 15 0.159117
13 Illinois 7 0.156068
14 Davidson 14 0.13716
15 James Mad 16 0.093564
16 Montana 13 0.088727
17 LIU-Brooklyn 16 0.085807

Now we go out to the South where 4 seed Michigan takes the top prize. #1 seed Kansas is not seen until number 11 because of their own high turnover numbers.


Ranking Team Seed Rating
1 Michigan 4 0.276919
2 Florida 3 0.262099
3 N Carolina 8 0.260269
4 San Diego St 7 0.257512
5 UCLA 6 0.220842
6 Oklahoma 10 0.202061
7 VCU 5 0.19434
8 Minnesota 11 0.188617
9 Georgetown 2 0.180294
10 Villanova 9 0.178146
11 Kansas 1 0.170712
12 Akron 12 0.153311
13 W Kentucky 16 0.123242
14 S Dakota St 13 0.115469
15 Fla Gulf Cst 15 0.093963
16 NW State 14 0.092668

The Midwest is not as surprising as 2 seed Duke takes the overall ranking. Michigan State, the 3 seed, does as expected and gets the #3 rating in this regional. #1 seed Louisville, also the overall #1, falls to number 4.


Ranking Team Seed Rating
1 Duke 2 0.28656
2 Colorado St 8 0.238288
3 Michigan St 3 0.227913
4 Louisville 1 0.227301
5 Cincinnati 10 0.193929
6 Creighton 7 0.186627
7 Oklahoma St 5 0.182852
8 Saint Louis 4 0.181537
9 St Marys 11 0.156642
10 Oregon 12 0.154807
11 Middle Tenn 11 0.147738
12 Memphis 6 0.144617
13 Missouri 9 0.136058
14 N Mex State 13 0.128778
15 Valparaiso 14 0.105194
16 NC A&T 16 0.098082
17 Albany 15 0.095416
18 Liberty 16 0.085434

Lastly we are in the west where the smart boys from Harvard are the #14 seed but are 16th in our power ranking. Ohio State takes the number one ranking here as well as the number one ranking overall.


Ranking Team Seed Rating
1 Ohio State 2 0.361423
2 New Mexico 3 0.238391
3 Kansas St 4 0.231722
4 Wisconsin 5 0.22469
5 Pittsburgh 8 0.22118
6 Gonzaga 1 0.218159
7 Notre Dame 7 0.199525
8 La Salle 13 0.186289
9 Arizona 6 0.18295
10 Mississippi 12 0.172984
11 Wichita St 9 0.157765
12 Belmont 11 0.156574
13 Boise State 13 0.155297
14 Iowa State 10 0.153723
15 Iona 15 0.135372
16 Harvard 14 0.103001
17 Southern 16 0.081688

That is the Hawks Report Bracket group: the pass word is hfsl if you would like to join.