Showing posts with label baseball. Show all posts

Thursday, March 21, 2013

What Makes A Pitcher Win?

Gio Gonzalez led the majors with 21 wins lat year
One of the first recorded statistics in sports was the pitcher's win, but where do those wins come from. Today we will look at what statistics correlate the most with wins. There has been a bit of a movement recently to stop considering the win an important statistic due to factors like run support and defense. But is it possible that wins come from stats like ERA and strikeouts already, and that there is no need to discount wins, but rather view them as the culmination of other statistics. The statistics that will be compared to wins today are ERA, K/9, K/BB, AVG, WHIP, BABIP, tERA, and Fastball Velocity. Stats appear in order of Correlation. 88 pitchers who qualified for the ERA tile were used in this study.
1. (ERA Earned Runs/ IP)x9
I cannot say that I am overly surprised with this one considering that it, along with wins and strikeouts, is one of the numbers in the pitching triple crown. Gio Gonzalez led the majors with 21 wins last year and had the 9th lowest ERA at 2.89. Clayton Kershaw, who led the majors with a 2.53 ERA had 14 wins. The biggest wrench in the data was Cliff Lee, who was last among the 88 pitchers with only 6 wins, but his 3.16 ERA was 15th overall. It earned the number one spot with a correlation of .64351.

2. WHIP (Walks + Hits)/ Innings Pitch
Clayton Kershaw again led the majors in this category with a 1.02 WHIP. Gonzalez placed 12th at 1.13. Jake Peavy and Cliff Lee threw curveballs in this category both placing in the top 10 but Peavy only had 11 wins and as said earlier Lee had 6. The correlation was -.55608.
3. True ERA ERA adjusted for Defense and other variables
Should have had more than 14 wins
Coming in third with a correlation of -.53644, tERA was led again by Clayton Kershaw who had a terrible offense in LA. Gio Gonzalez placed fifth with a tERA of 3.34 and Cliff Lee showed up again screwing up the data with the third lowest tERA. Jeremy Guthrie, who only had 8 wins, had the highest tERA of the 88 pitchers with 6.33.
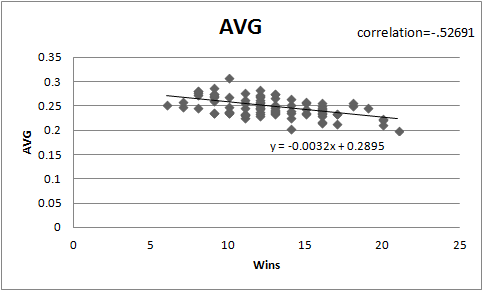
4. Batting Average Against
Gonzalez led the majors with a .202 BA against so that might make you think that this should have the strongest correlation. Another reason that this might be seen to have a high correlation is that Cliff Lee and his 6 wins doesn't show up until 55 on this list. The problem with this is that most of the data is spread throughout with Nationals' Edwin Jackson and Ross Detweiler taking 22 and 23 with 10 wins and BA of .237.
5. Strikeouts per 9 innings
There was a huge dropoff here going from a -.52691 correlation to a .295676 correlation for K/9. Max Scherzer led with 11.08 and had 16 wins. Yu Darvish was second with 10.4 and also had 16 wins. Gonzalez was third in K/9. Clayton Richard had 14 wins but only had 4.4 K/9.

6. Batting Average Against on Balls in Play
This stat is often used to project how a player will do in following seasons or how a player will do whe traded to a new team  but it does not correlate that well with wins. In fact, the correlation is only -.27. Jared Weaver led the majors with a .241 BABIP and as second in the league with 20 wins. However, Ervin Santana, who was second in BABIP, only had 9 wins.
7. Strikeouts/ Walks
This stat really seems like it should be a strong indicator of who wins or loses but the the pitchers with the highest two K/BB, Cliff Lee and Joe Blanton only had 6 and 10 wins respectively. This again is just because Cliff Lee had a terrible offense in Philadelphia, at least when he pitched. Gonzales doesn't appear til 46 on the list, having a K/BB of 2.72.

8. Fastball Velocity
Proves You Don't need to throw hard to win
This only has a correlation of .09 and that is really to be expected. We should all know that wins has very little to do with how hard you throw the ball, but how you make it dance and where you put it. It doesn't hurt necessarily as David Price had the hardest fastball in the majors with 95.5 MPH and had 20 wins. Jeff Samardzija had the second fastest fastball but only 9 wins, mostly due to the Cubs sucking ass. Gio's fastball averaged 93 MPH. Knuckleballer RA Dickey had 20 wins with a fastball of only 83.4 MPH.


Sunday, October 28, 2012

15 Numbers that Actually Mattered in Baseball this year

If Only I would have bet on them every game this year

With the MLB season about over, as I'm writing this I am waiting for game 4 tonight. It is safe to assume that the Giants will win it all this season but we all know that really that isn't what sports are about. So now I will present you with the numbers that actually mattered this year. Also remember that this numbers are just a representation of what people thought thought in the beginning of the year and that gambling on sports is VERY VERY BAD and is not at all the only reason that sports are a major industry.
1. The money on Oakland to win the division this year was +3700 making them the biggest upset among division winners. 
2. Baltimore, while they took second division were at +10,585 to win it at the beginning of the year. I know that a Baltimore fan has to be excited that the team made the playoffs for the first time in forever, but anyone that bet on them ended up 2 games a way from a huge pay day.
3. Washington was the second biggest upset to win the division at +699.
4. The Phillies, at 11/2, were pre-season favorites to win the World Series and did not even make the playoffs.
5. The presumable champion San Francisco Giants started the season at 15:1 odds
6. Oakland managed a 97-62 record against the spread this year
7. The Cleveland Indians were a disappointing 66-95 against the spread
Bye-Bye Bobby
8. Philadelphia and Boston both had disappointing seasons both in gambling and in the playoff rice; finishing 66-92 and 70-91 against the spread respectively
9. The Cardinals and Rangers; who both made the playoffs as well as meeting in the World Series last year finished 74-86 and 74-87 respectively
10. You like a lot of runs? then the Brewers are for you. 55% of their games ended up in the over categorey
11. Do you enjoy the plate being clean the whole game? Then watch the Reds as 63% of their games were under the line
12. Oakland was 61-53 as the underdog and Baltimore was 58-51; meanwhile Texas was 9-13
13.  Yankees were 83-57 as the favorites; Texas was 83-56
14. Oakland covered by an average of 1.2 runs
15. 0, the total number of beers and chicken wings consumed by the Red Sox in the clubhouse this year. Also happens to be the number of playoff games they played in this year.

Wednesday, October 3, 2012

Using PER to rank the major league bullpens

despite the #1 bullpen, the rays were unable to
make the playoffs
It is commonly known that a good bullpen is a key to a strong season. Now that the season only has one day left I believe that now is a fair time to assess each team's bullpen for the 2012 season. According to PER , Hawks Report's new metric, PER, 7 out of the top 10 best bullpens in baseball have reached the playoffs. The number one bullpen in baseball , the Rays,are out of the Wild Card Showdown by 3.5 games before the last games end . The Diamondbacks also find themselves in the top 10 at spot number 6, they werable to finish 6 games out of the wild card despite also having one of the better offenses in the game. The three playoff teams that were outside the top 10 were the Cardinals (16), Tigers (19), and the Giants (25). Here are your 2012 team bullpen PER rankings. Teams in yellow have clinched the wild card,, blue have clinched the division, and orange have clinched a playoff spot.
Team IP TBF Rating
Rays 462.3 1877 0.246297
Braves 478.3 1968 0.243039
Athletics 505.6 2089 0.24203
Rangers 452.3 1870 0.241872
Diamondbacks 464.6 1930 0.240725
Orioles 542.3 2260 0.239956
Nationals 513 2149 0.238716
Reds 430.3 1804 0.238525
Yankees 442 1857 0.238018
Dodgers 461 1939 0.237751
Mariners 453 1906 0.237671
Red Sox 509 2142 0.237628
Indians 524 2207 0.237426
White Sox 463.6 1958 0.236772
Twins 555.6 2347 0.236728
Cardinals 470.3 1992 0.236094
Royals 559.3 2372 0.235793
Angels 442 1875 0.235733
Tigers 453.6 1926 0.235514
Padres 499 2121 0.235266
Pirates 495.3 2114 0.234295
Phillies 416.3 1782 0.233614
Blue Jays 526.6 2259 0.233112
Giants 449.6 1937 0.232112
Mets 457 1989 0.229764
Rockies 653 2864 0.228003
Marlins 454.3 1997 0.227491
Astros 499.3 2204 0.226543
Brewers 507.3 2252 0.225266
Cubs 488.3 2186 0.223376

Monday, October 1, 2012

Introducing Pitcher Efficiency Rating (PER)

I do not claim to be a great sabretician and I understand that this formula might have been created by someone else without me being aware and that is the case then I am sorry. Pitcher Efficiency Rating is a very simple formula and is just innings pitched/total batters faced. As you would expect, the best pitchers lead this category so there are very few players that jump out of nowhere but I think it helps sort out who is the best among the best. If you would combine both relievers and starters for this statistic you would find that the 10 rated pitchers are relievers while the first starter to appear in this rating would be Jered Weaver at #11. Here we take a look at the top 15 starting pitchers in baseball:
Player Team Efficiency Rating
Jered Weaver Angels 0.255737705
David Price Rays 0.252392344
R.A. Dickey Mets 0.251605759
Clayton Kershaw Dodgers 0.251376147
Matt Cain Giants 0.249824971
Cliff Lee Phillies 0.249695493
Justin Verlander Tigers 0.249058577
Chris Sale White Sox 0.248704663
Felix Hernandez Mariners 0.248571429
Cole Hamels Phillies 0.248096886
Jake Peavy White Sox 0.246783626
Mike Minor Braves 0.246016484
Hiroki Kuroda Yankees 0.245886443
Madison Bumgarner Giants 0.245111896
Jason Vargas Mariners 0.24475761
Jered Weaver comes in as #1 in PER
There are no real surprises in that list other Jason Vargas and Mike Minor, neither of whom appear in the top 40 of ERA. This can be accounted to weak defense although I doubt that is the only reason. Johnny Cueto, who is #7 in ERA, falls just outside the top 15. David Price has the best ERA but Jered Weaver beats him out in the Efficiency Rating. This should be no surprise considering Weaver is considered by many as the best pitcher in baseball. Now let’s take a look at the top 10 relievers in baseball.
Player Team Rating
Craig Kimbrel Braves 0.269604
Fernando Rodney Rays 0.264855
Casey Janssen Blue Jays 0.260426
Brad Ziegler Diamondbacks 0.258594
Kenley Jansen Dodgers 0.258333
Jake McGee Rays 0.257767
Aroldis Chapman Reds 0.257143
Kris Medlen Braves 0.256398
Jason Motte Cardinals 0.255839
Sergio Romo Giants 0.255189
Former Dominican Catcher
and current Dodgers closer Kenley
Jansen is one  of the top relief pitchers

Again, there are no surprises here as Craig Kimbrel, probably the best closer in baseball heads the list. The Rays and Braves seem to have the best the best bullpen as they both have two of the top relief pitchers according to efficiency rating. For full ratings you can check out these links.
Just make sure to zoom.
Starting Pitchers
Relief Pitchers