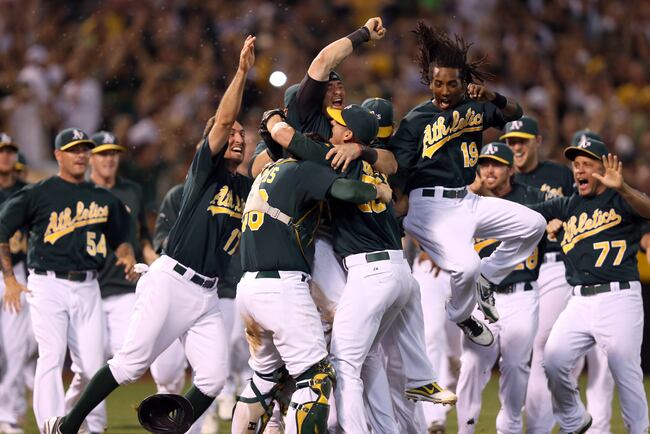
| Best ERA- but didn't mean a championship |
It is safe to say that both team's and and pitcher's need to do the same thing to win, and that is to prevent the other team from crossing home plate. That is why ERA has the biggest correlation between winning and a statistic for both individuals and a group. After we determined that runs were the most important thing in winning games, today we decide that runs against is just as important. Along with ERA the other stats measured today will be: saves, batting average against, WHIP, batting average on balls in play, Fielding Independent Pitching, and the ERAs of both the team's relievers and starters. All stats except for Saves naturally have a negative correlation due to their nature of lower is better, so the absolute value of those stats were taken while Saves had their normal correlation.
1. ERA correlation=.8125
| Gonzalez |
The Rays had the league's lowest ERA at 3.19 and had the 9th most wins with 90. The Washington Nationals, led by Gio Gonzalez and Steven Strasburg, had the second best ERA and led the majors with 98 wins. The World Series Champion Giants had a 3.68 ERA which is good enough for 7th on the list. Despite a 3.76 ERA, the Mariners were only able to win 75 games.
2. WHIP correlation=.803
Again similar to ERA, David Price and the Rays led the majors with a WHIP of 1.17 and the Nationals took second at 1.22. Felix Hernandez again got the Mariners in the top 6 despite their lackluster record. The Brewers were the only team with a WHIP above 1.3 to win more than 80 games.
3. Saves correlation= .77889
Not really surprise here as you can only get a save if you win the game. The Reds had the most saves in the majors (56) and Aroldis Chapman had 38 of them and they won 97 games. The Pirates had 45 saves (Joel Hanrahan having 36 of them) despite only winning 79 games. The Orioles finished second in saves as Jim Johnson got 51 of their 55 saves. The Angels won 89 games despite recording only 38 saves as they were a little bit of an outlier.
4. Starter ERA correlation= .71457
What a surprise here, again the Rays and the Dodgers take the top two spots. Clayton Kershaw led the majors in ERA and it helped the Dodgers get the third spot with a starter ERA of 3.41 and 86 wins. The Mets R.A. Dickey boosted them into the 11 spot but they only had 74 wins on the year. The Orioles, who are looking to have a pretty bad this year, made it far with bad starters sporting an ERA of 4.42 but won 93 games.
5. Batting Average Against Correlation=.704
So again the Rays, Nationals, and Dodgers take the top three spots with opponent batting averages below .235. The Rockies, who have been near the bottom of the list in almost every category are in dead last here with teams hitting .284 of their pitchers, which is .014 points higher than the second to last Twins. Not surprisingly, the Rockies only won 64 games.
6. Fielding Independent Pitching correlation=.684
| Just wanted to show the Cuba Red |
This statistic is used to determine the ERA of a pitcher if it wasn't for shoddy defense, or in the other direction great defense. The Rays and Nationals again take the top two spots but three and four look a little different this time. Adam Wainwright's FIP of 3.10 led the Cardinals to the 3 spot and Justin Verlander's 2.94 FIP put the Tigers in fourth.
7. Reliever ERA correlation=.6525
Aroldis Chapman had the third best ERA among reliever's last year (1.51) and it helps put the Reds on top of the list. The Braves took second with Craig Kimbrel and Eric O'Flaherty both finishing in the top 5. Fernando Rodney had a major league best .60 ERA for the Rays and the team had a 2.88 reliever ERA which was third in the league. The World Champion Giants had the 15th best bullpen but that was likely do to Brain Wilson missing most of the season.
8. Batting Average on Balls in Play correlation=.48
Not a terrible correlation but not a good one. The Tigers were 27th in the league in BABIP and still had 81 wins and the Yanks won 95 despite finishing 19th. The Rays and Angels were first in the league with a .277 BABIP and the Athletics who won 94 games finished third witha .279 BABIP.